[Paper Review]
“Title ROSPaCe: Intrusion Detection Dataset for a ROS2-Based CyberPhysical System and IoT Networks”:
Journal: SCIENTIFIC DATA - NATURE
- Context: CyberPhysical System and IoT Networks
Addressed problem
- Most of the intrusion detection datasets to research machine learning-based intrusion detection systems (IDSs) are devoted to cyber-only systems, and they typically collect data from one architectural layer.
- Attacks are generated in dedicated attack sessions, without reproducing the realistic alternation and overlap of normal and attack actions.
Proposal
- Authors proposed a dataset for intrusion detection by performing penetration testing on an embedded cyber-physical system built over Robot Operating System 2 (ROS2).
- Features are monitored from three architectural layers: the Linux operating system, the network, and the ROS2 services.
- The dataset is structured as a time series and describes the expected behavior of the system and its response to ROS2-specifc attacks: it repeatedly alternates periods of attack-free operation with periods when a specifc attack is being performed.
Dataset highlights
- Research other relevant datasets.
- Authors pay attention to:
- CPS environent,
- Features type and number,
- Data points,
- If the attacks performed were:
- application-specifc attacks or
- dynamic attacks, and, lastly,
- Detector accuracy.
Authors use the term multiple architectural layers > the origin of the features.
Authors quote that they do not use any synthetic data-generation mechanism for the events when there are no attacks.
- They focus on:
- Attack detection accuracy and
- Detection speed.
- Pending to analyze this quote:
For example, notorious datasets like CICIDS17 are composed of long periods of normal operativity, followed by long periods where diferent attacks are injected. In this way, the scenario of an attacker entering the system and performing actions on an “attacker-free” system is insufciently captured
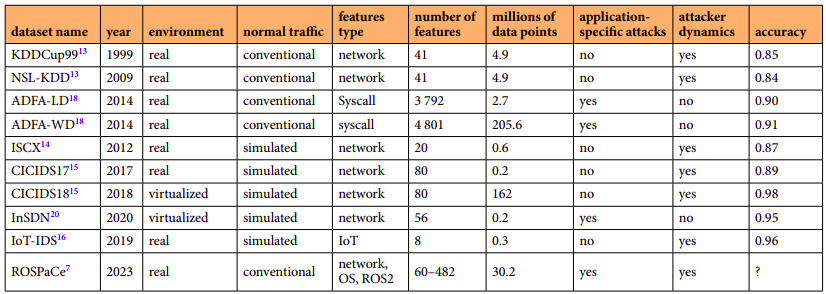 Figure: Most famous dataset for IDS
Network Architecture
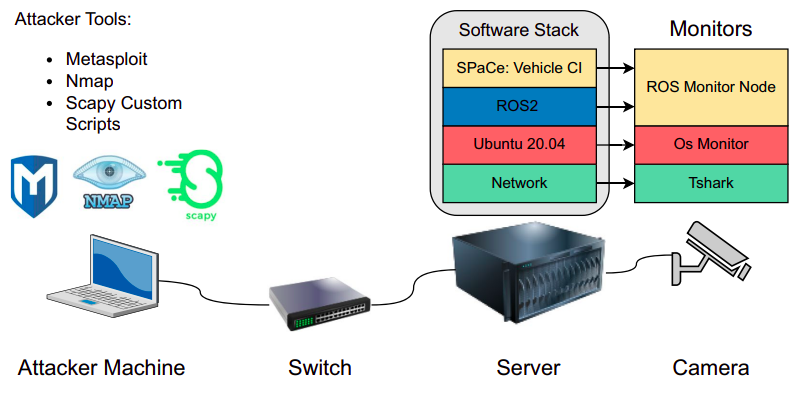 Figure: The setting of our experimental campaign. The Ubuntu 20.04 Server runs ROS2, and it is connected to one camera sensor via a LAN cable. The attacker operates from an Ubuntu 20.04 laptop connected via a switch. The attacker tools are Metasploit, Nmap, and custom scripts implemented using the Scapy library. The sofware probes monitor data from three architectural layers: the network,the operating system, and the ROS2 middleware and microservices.
- Three layers:
- Application monitor > 25 features >
pgpout(Number of pageouts since the last boot) - Operative-System monitor > 5 features >
src_topic(Indicates the source node of a specifc message) - Network monitor > 451 features >
ipv6
- Application monitor > 25 features >
- Switch-based LAN architecture (minimalistic):
- Attacker (Ubuntu 20.04)
- Monitored element: CCTV camera
- A server (Linux Ubuntu 20.04 & ROS2 foxy):
- Data analysis
- Attack or not attack
- Attacks are orchestrated, but simple:
- Reconnaisance (NMAP) > Simple discovery of the network.
- Exploitation (METASPLOIT, other scripts) > Different types of Denial of Service (DoS).
- These are not Advanced Persistent Threats (APTs)
Data collection
 Figure: The script that automates the execution of the experimental campaign
- Select a new attack.
- Wait 30 seconds. No attack-period.
- Inject the attack x, for a maximum temporal duration t.
- Stop injecting x and keep the system in a hiatus state for 10 seconds.
- This period is set to allow the system to restore a clean state. We expect that afer this period, the efect of the attack will no longer manifest on the monitored features. In case services are crashed or unable to recover, the system is rebooted, and the experimental campaign restarts from step 2.
- Repeat steps 2, 3, and 4 for 400 iterations.
- This means that 400 sequences of normal operations and successive injections of attack x will be logged.
- Wait 90 seconds to restore a clean system state, then restart from 1.
Technical Validation of the Dataset
1. Feature ranking and data visualization
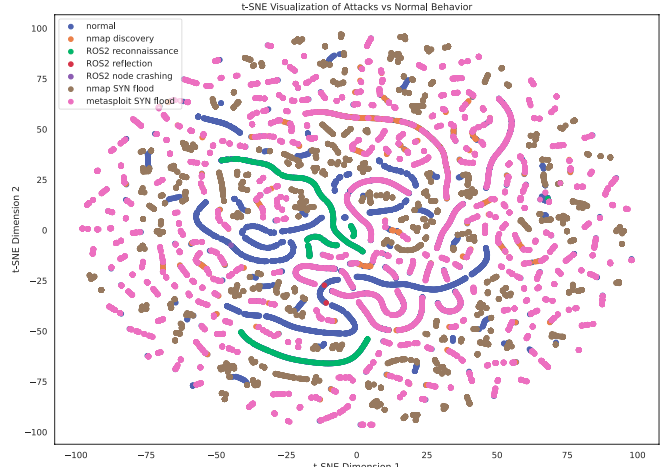 Figure: t-SNE visualization of normal or attack classes (painted in diferent colors) using layers.ipv6.ip version, pgpgout, and src_topic as features.
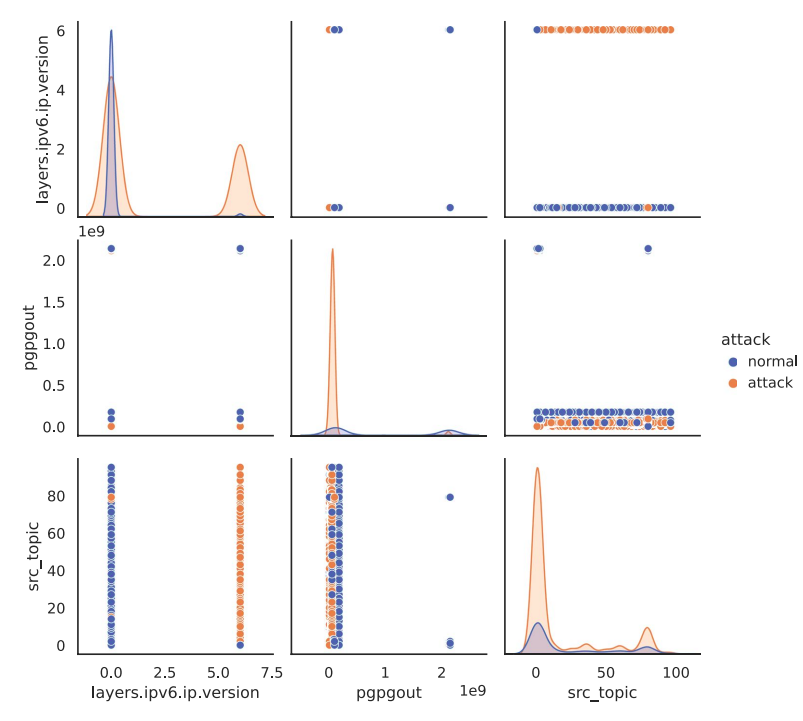 Figure: Seaborn scatterplot for the layers.ipv6.ip version, pgpgout, and src_topic features. Te diagonal plots show the distribution of each variable individually. The plots above the diagonal show the relationship between diferent pairs of variables.
2. ML Models to test dataset
MODELS
- Isolation Forests
- XGBoost
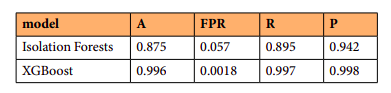 Figure: Performance metrics for Isolation Forest and XGBoost obtained by applying the Usage Notes-A. We report on the accuracy (A), the False Positive Rate (FPR), the Recall (R), and Precision (P).
Receiver Operating Characteristic curve (ROC)
 Figure: ROC curve and Precision-Recall curve of XGBoost and Isolation Forest on the ROSPaCe7 reduced dataset.
What does the ROC curve tell you?
- Area Under the Curve (AUC): The overall performance of a classifier is often summarized by the AUC (Area Under the ROC Curve). A perfect classifier has an AUC of 1, while a random guesser has an AUC of 0.5.
- Threshold Sensitivity: The curve shows how sensitive the model’s performance is to different classification thresholds. Lowering the threshold typically increases both TPR and FPR.
- Performance Comparison: ROC curves are often used to compare the performance of different classifiers. The classifier with a ROC curve closer to the top-left or with a higher AUC value generally performs better.
3. Attack Detection Speed
 Figure: Attack latency, in seconds. We provide the minimum value, the maximum value, and the standard deviation.